
App Store Connect Analytics: A Practical Guide for Indie Developers
July 12, 2026
App Store Connect analytics can tell you how people discover, download, use, and pay for your app. The difficult part is not finding another chart. It is deciding what a change in the chart means and what, if anything, you should do next.
An increase in impressions is not automatically growth. A drop in conversion rate is not automatically a screenshot problem. Revenue can rise while the number of paying subscribers stays flat. Even a visible crash spike needs to be checked against app version and usage volume before it becomes a useful diagnosis.
This guide explains the App Store Connect metrics that matter most to indie iOS developers, a repeatable weekly analytics workflow, and how to turn a signal into a product, App Store Optimization, or release task.
What does App Store Connect analytics show?
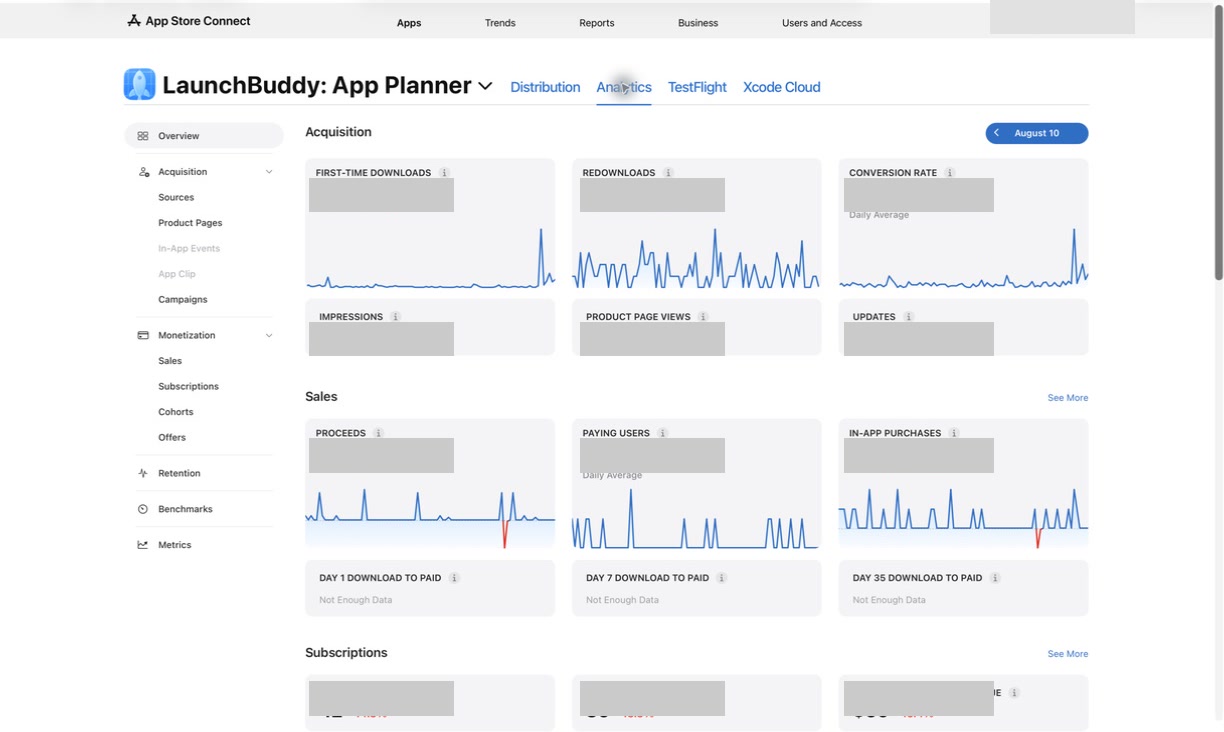
Apple’s current Analytics dashboard brings several parts of the app journey together:
- Acquisition: impressions, product page views, downloads, conversion, and acquisition sources
- Engagement: installations, sessions, active devices, deletions, and retention
- Quality: crashes and related app-version trends
- Monetization: sales, proceeds, paying users, and in-app purchases
- Subscriptions: trials, offers, paid plans, renewals, churn, and monthly recurring revenue
- App Store features: custom product pages, in-app events, and other supported features
These categories answer different questions. Acquisition tells you whether people reach and download the app. Engagement tells you what happens after installation. Monetization tells you whether usage becomes a purchase. Quality helps explain why users may stop.
Do not combine all of those into a single idea of “performance.” A release can improve retention without changing downloads. A marketing campaign can increase downloads while attracting users who never return. A pricing change can increase proceeds while reducing the number of new paid plans.
The essential App Store Connect metrics
Start with a small set of metrics you understand. Apple’s metric definitions are the source of truth, and they are worth checking because similar-sounding metrics count different events.
Impressions
Impressions count how many times your app was viewed for more than one second on the Today, Games, Apps, and Search tabs of the App Store. Product page views are included.
The unique-device version answers a slightly different question: how many distinct devices saw the app during the selected period?
Impressions are a discovery signal. They can change because of:
- Search visibility
- Featuring or browse placement
- Seasonality
- Apple Search Ads
- Category demand
- A launch or external campaign
- Changes to the app name, subtitle, or keywords
An impression does not mean someone understood the product or seriously considered downloading it.
Product page views
Product Page Views count visits to the full App Store product page, including product pages loaded through StoreKit. Use unique product page views when you want to reason about distinct devices rather than repeat visits.
The relationship between impressions and page views can be useful:
- Impressions up, page views flat may indicate that more people see the app but are not interested enough to open the listing.
- Page views up from a campaign may be expected because external links often send people directly to the product page.
- Page views and downloads rising together is more encouraging than an isolated increase in views.
Do not treat the ratio as a universal score. Search results, editorial placement, custom product pages, and external referrals create different user journeys.
First-time downloads, redownloads, and total downloads
Apple separates downloads into:
- First-Time Downloads: the first download of the app on a device
- Redownloads: a later download through the App Store
- Total Downloads: first-time downloads plus redownloads
Redownloads do not include automatic downloads, updates, or device restores. If total downloads rise because redownloads rise, that is a different story from acquiring the same number of brand-new users.
Use first-time downloads for acquisition questions. Review redownloads separately when a new release, re-engagement campaign, or returning audience may be responsible.
Conversion rate
In App Store Connect, Conversion Rate is total downloads and pre-orders divided by unique-device impressions. A pre-order counts when it happens and is not counted again when the app later downloads.
This definition produces two important cautions:
- It uses total downloads, not only first-time downloads.
- It uses unique impressions, not product page views.
That means App Store Connect conversion rate is not simply “the percentage of product page visitors who installed.” Avoid comparing it directly with a web landing-page conversion rate that uses a different denominator.
Segment conversion by source, territory, product page, and period before drawing a conclusion. Search traffic and an external campaign can have very different intent.
Installations, active devices, sessions, and deletions
Downloads describe an App Store event. Installations and usage metrics describe activity on devices.
- Installations count completed installs and can include redownloads, Family Sharing installs, and installs on multiple devices using the same Apple Account.
- Active Devices are devices with at least one session in the selected period.
- Sessions measure app usage that meets Apple’s session definition.
- Deletions count removal of the app in supported circumstances.
These metrics are not expected to match downloads one for one.
Apple bases usage metrics on users who have opted in to share diagnostics and usage information. Usage data also has availability thresholds. Check the opt-in rate and selected date range before treating a small movement as representative of every user.
Retention
Retention shows the percentage of devices in an installation cohort that open the app on later days. It is more useful when read as a curve than as one isolated percentage.
Ask:
- Where is the steepest drop?
- Did the curve change after a specific release?
- Do users acquired from one source return more often?
- Did an onboarding change improve early retention?
- Does a crash spike line up with weaker retention for the same version?
Retention can take time to mature. You cannot fairly compare Day 28 retention for an old cohort with a new cohort that has not reached Day 28.
Sales, proceeds, and revenue
Apple distinguishes Sales from Proceeds:
- Sales are the amount billed to customers for apps and in-app purchases, with taxes included only where they are part of the customer price.
- Proceeds are the estimated amount you receive after applicable taxes and Apple’s commission.
Neither should be confused with a final bank payment. Exchange rates, transaction lifecycle, adjustments, and financial reporting can create differences. Use Payments and Financial Reports for reconciliation.
For product decisions, compare monetization with the behavior that can explain it:
- Paying users
- In-app purchases
- First-time downloads
- Conversion to paid
- Territory
- Product
- Subscription plan
A proceeds increase is useful. Knowing whether it came from more customers, a price change, annual-plan renewals, or one territory is more useful.
Subscription metrics
For an auto-renewable subscription app, a small operating dashboard might include:
- Active Plans: active subscriptions including free trials, paid offers, and paid subscriptions
- Paid Plans: active subscriptions in Apple’s paid pricing states
- Monthly Recurring Revenue: revenue from active paid subscriptions normalized to a monthly period
- Trial to Paid Conversion: completed trials that became paid subscriptions
- Plan Starts: new paid subscription starts
- Churn: subscriptions that became inactive
- Recoveries: subscriptions that returned from an inactive or billing-problem state
Never read trial starts alone. A promotion can produce many trials without producing durable paid plans. Pair starts with conversion, churn, and a sufficiently mature cohort.
Start with a question, not a dashboard
Opening App Store Connect and looking for a surprising line creates noise. Write down the question first.
Good analytics questions are specific and tied to a decision:
- Did the new screenshots improve conversion from App Store search?
- Did version 3.2 increase crashes compared with version 3.1?
- Did the onboarding change improve Day 1 and Day 7 retention?
- Did the annual-plan test increase paid conversion or only trial starts?
- Which acquisition source produced users who returned?
- Did the launch increase first-time downloads, or mostly redownloads?
Weak questions are too broad:
- Is the app doing well?
- Why are downloads bad?
- What feature should I build?
- How do I grow?
Analytics can narrow a problem. It rarely supplies the entire product decision by itself.
A weekly App Store Connect analytics workflow
For a small app portfolio, a consistent 20-minute review is more useful than repeatedly checking yesterday’s revenue.
1. Record what changed
Before opening a chart, list the events that could affect it:
- App version released
- Featuring or campaign started
- Price changed
- Free trial or offer changed
- Screenshots, icon, name, subtitle, or keywords updated
- App Store outage or known product incident
- Seasonal event
- Unusual press or social traffic
Use exact dates. “Around the launch” is not precise enough when a release, campaign, and metadata change happened in the same week.
2. Choose a fair comparison
Compare like with like:
- Seven complete days against the previous seven complete days
- The same weekdays before and after a release
- A release cohort against the previous release cohort
- A campaign against a clearly defined baseline
- Year over year when seasonality is strong
Avoid comparing a partial current day with a complete prior day. Also check whether reporting delay could explain missing recent data.
3. Read the acquisition funnel
Review these in order:
Unique impressions
→ Unique product page views
→ First-time downloads and redownloads
→ Conversion rate
Then segment the change by source, territory, and product page.
If conversion changed, first ask whether the traffic mix changed. A lower aggregate conversion rate can happen even when every source performs normally, simply because a larger share of impressions came from a lower-intent source.
4. Check post-download behavior
Next, inspect:
- Active devices
- Sessions per active device
- Deletions
- Retention cohorts
- Crashes by app version
This step stops you from optimizing only for installs. A campaign that brings more downloads but no durable usage may not deserve more budget. A release that improves retention can be valuable even if acquisition is unchanged.
5. Review monetization in context
For a paid or in-app purchase app, compare sales and proceeds with paying users and purchases. For subscriptions, compare paid plans and monthly recurring revenue with starts, conversions, renewals, and churn.
Ask which event changed:
- More people reached the paywall
- More people started an offer
- More offers converted
- Existing subscribers renewed
- A price or plan mix changed
- Fewer subscribers churned
Revenue tells you the result. The surrounding metrics help identify the mechanism.
6. Convert only strong signals into tasks
Every chart movement does not need a backlog item. Create a task when:
- The change is large enough to matter
- The definition and comparison are understood
- A release, source, territory, or product segment helps locate it
- There is a plausible action you can test
- You can define what success would look like
Write the evidence into the task:
Signal:
Conversion rate from App Store search fell after the 3.2 product-page update.

Comparison:
14 complete days before vs. 14 complete days after.

Segments checked:
US storefront, App Store search, default product page.

Possible explanation:
The new first screenshot emphasizes the advanced editor before the core benefit.

Next action:
Prepare a product page optimization treatment with benefit-led screenshot copy.

Success metric:
Search-source conversion rate, with first-time downloads as a guardrail.

Review date:
After the experiment reaches a useful sample.
This is much better than a task called “Improve conversion.”
How to diagnose common analytics patterns
Use patterns as investigation prompts, not automatic conclusions.
| Pattern | Check next | Possible action |
|---|---|---|
| Impressions rise, page views stay flat | Source, search relevance, browse placement | Review positioning, icon, subtitle, or traffic quality |
| Page views rise, downloads stay flat | Product page, territory, rating, pricing | Test screenshots or clarify the value proposition |
| Total downloads rise, first-time downloads do not | Redownloads, release date, re-engagement | Identify why existing users returned |
| Downloads rise, active devices stay flat | Opt-in rate, reporting delay, retention, deletions | Inspect acquisition quality and onboarding |
| Crashes rise after release | App version, OS version, device | Triage in Xcode and create a hotfix task if warranted |
| Trials rise, paid plans stay flat | Trial maturity, trial-to-paid conversion, churn | Review offer quality, onboarding, and paywall promise |
| Proceeds rise, paying users stay flat | Price, product mix, territory, renewals | Confirm whether the increase is repeatable |
| Aggregate conversion falls | Source and territory mix | Diagnose segments before changing creative |
The “possible action” column is deliberately not a verdict. For example, low product-page conversion can reflect weak screenshots, but it can also reflect an audience mismatch, poor ratings, pricing, localization, or a campaign promise that the app does not satisfy.
Measure an iOS release without fooling yourself
A release is not a controlled experiment. It often changes code, onboarding, screenshots, marketing, and acquisition volume at the same time. Still, a simple measurement plan can make the result more useful.
Before release, record:
Release:
Version:
Release date:
Primary user outcome:

Main metric:
Current baseline:
Expected direction:

Guardrail metrics:
- Crashes
- Deletions
- Conversion rate
- Trial-to-paid conversion

Segments:
- App version
- Territory
- Acquisition source
- Product page

Other changes during the window:
- Metadata:
- Pricing or offers:
- Marketing:
- Seasonality:

First review date:
Longer-term review date:
Choose one primary metric that matches the release goal. If the update redesigns onboarding, early retention may be more relevant than impressions. If it changes screenshots only, acquisition conversion is more relevant than sessions.
Guardrail metrics catch damage outside the primary goal. An onboarding update may improve activation while causing more crashes. A paywall test may improve trial starts while increasing early churn.
For the operational side of the release, use an iOS app release management workflow so the version, completed tasks, TestFlight evidence, and post-launch checks remain connected.
Use App Store analytics for ASO experiments
App Store Optimization should be measured as a sequence of hypotheses, not a collection of random metadata edits.
For each experiment:
- State the audience and problem.
- Record the current name, subtitle, screenshots, icon, or product page.
- Choose the source and territory you intend to affect.
- Save the baseline date range.
- Change as few variables as practical.
- Wait for enough data and a complete comparison period.
- Record the result, including a neutral or negative outcome.
If you change keywords, screenshots, and pricing on the same day, you may improve the app while learning very little about which change worked.
Use Apple’s Product Page Optimization when it fits the question. For broader work, keep a manual record of the hypothesis and result. LaunchBuddy’s ASO experiments are designed for tracking icon, screenshot, and copy tests with baseline and experiment metrics alongside each app.
For the metadata itself, see the App Store metadata management guide and the App Store keyword field guide.
Common App Store Connect analytics mistakes
Treating correlation as a cause
A metric changed after a release, but “after” does not prove “because of.” Check campaigns, featuring, seasonality, source mix, pricing, and other simultaneous changes.
Using mismatched definitions
Downloads are not installations. Sales are not proceeds. Active plans are not paid plans. App Store conversion rate does not use product page views as its denominator.
Write the metric definition beside an important decision.
Ignoring filters
An overall chart can hide a severe issue in one version or a strong result in one territory. Segment before averaging everything together.
Reacting to incomplete data
Recent reports can be delayed, retention cohorts need time to mature, and low-volume data can be noisy. Compare complete windows.
Ignoring opt-in and privacy thresholds
Usage, retention, and some quality data represent users who agreed to share analytics. Small apps may also see blank or limited data where privacy thresholds are not met. Missing data is not the same as zero usage.
Watching metrics without recording decisions
Checking revenue five times a day does not improve the app. A useful review ends with one of three decisions:
- Act now
- Keep observing until a named date or threshold
- Record no meaningful change and move on
App Store Connect analytics for small apps
Low volume does not make analytics useless, but it changes the workflow.
For a small or newly launched app:
- Use longer date ranges.
- Prefer raw counts alongside percentages.
- Avoid reacting to one or two events.
- Record qualitative evidence from reviews and TestFlight.
- Compare release cohorts only after both have matured.
- Make fewer simultaneous changes.
- Treat blank privacy-threshold data as unavailable, not zero.
If conversion moves from 25% to 50% because downloads increased from one to two, the percentage sounds more decisive than the evidence is. Keep the count visible.
Customer reviews can add context, but they are not a representative survey. Use them to find specific problems and language, then compare those themes with product and release evidence. The App Store review reply generator guide explains how to turn actionable reviews into tasks without letting AI invent the diagnosis.
How LaunchBuddy helps with App Store Connect analytics
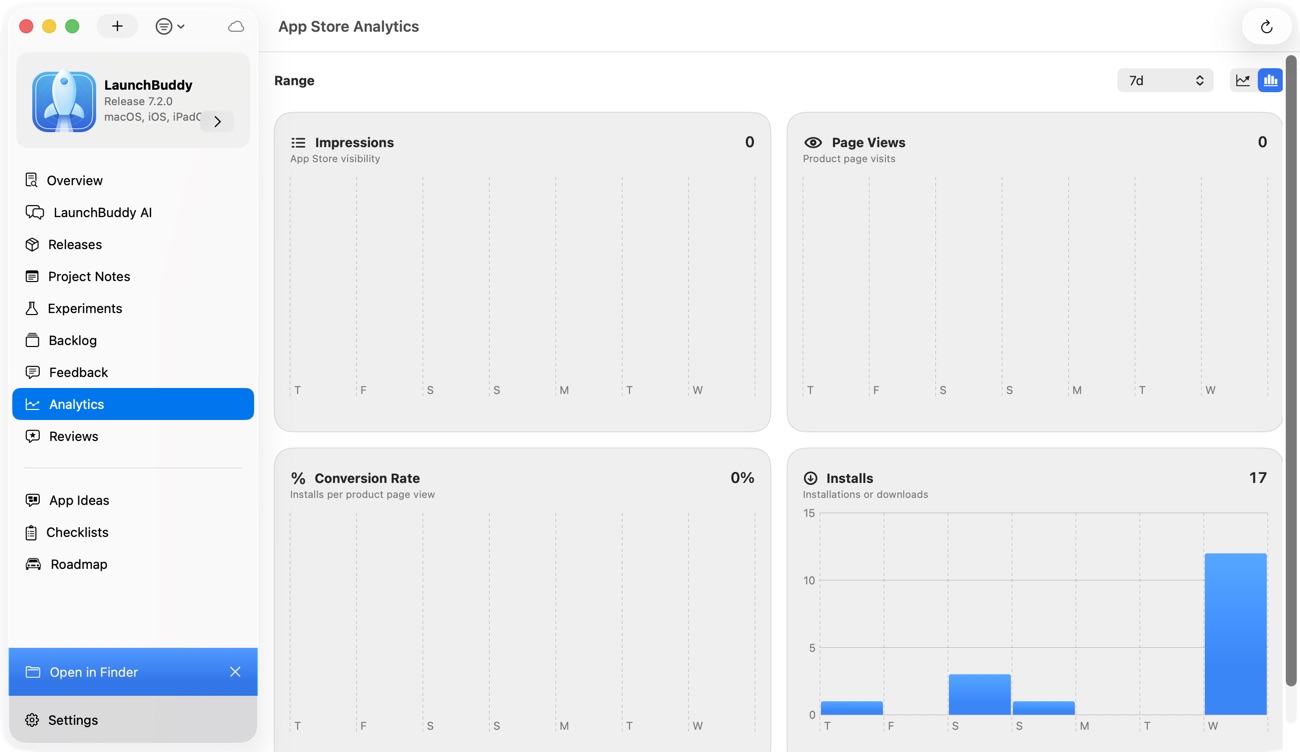
LaunchBuddy is a project and release manager for indie iOS developers. LaunchBuddy Pro includes an App Store Connect dashboard for downloads, revenue, and subscription metrics, alongside the apps and releases you are already managing.
That makes it easier to move from a number to a decision:
- View key App Store metrics without keeping another browser dashboard open
- Compare the signal with the release and tasks that may have affected it
- Create product, ASO, or follow-up work for the correct app
- Keep post-launch checks attached to the release
- Track icon, screenshot, and copy experiments with their baseline and result
- Read App Store reviews and turn low-star feedback into backlog tasks
- Keep the workflow current across iPhone, iPad, and Mac with iCloud sync
LaunchBuddy does not replace Apple’s full Analytics dashboard or financial reports. Use App Store Connect for detailed segmentation, metric definitions, peer benchmarks, and payout reconciliation. Use LaunchBuddy when the important next step is connecting a metric to the release plan and work you will actually do.
The App Store Connect integration requires an API key from Apple. Create a narrowly scoped key and protect the private key. The App Store Connect API key guide covers setup and security.
Frequently asked questions
What is the difference between App Analytics and Sales and Trends?
Analytics focuses on the journey from App Store discovery through downloads, engagement, retention, quality, and monetization. Sales and financial reports serve related but different reporting and reconciliation needs. Use the metric definition and report intended for your question rather than expecting every total to match.
Why do App Store Connect downloads and installations differ?
They count different events. Downloads are App Store transactions split into first-time downloads and redownloads. Installations count completed installs on devices and can include multiple devices, redownloads, and Family Sharing. Usage metrics also depend on user analytics opt-in.
How is App Store conversion rate calculated?
Apple calculates it as total downloads and pre-orders divided by unique-device impressions. It is not downloads divided by product page views.
Why is App Store Connect analytics data missing?
Possible reasons include reporting delay, an incomplete date range, insufficient data, privacy thresholds, user analytics opt-in, or a metric that requires a feature such as auto-renewable subscriptions. Check the definition and filters before interpreting a blank value.
Which App Store analytics metrics should an indie developer track?
Start with first-time downloads, redownloads, conversion rate, active devices, retention, crashes, and proceeds. For subscriptions, add paid plans, monthly recurring revenue, trial-to-paid conversion, and churn. Remove any metric that does not inform a real decision.
Does LaunchBuddy show App Store Connect analytics?
Yes. LaunchBuddy Pro can show downloads, revenue, and subscription metrics through its App Store Connect integration. It also keeps those signals closer to release tasks, reviews, checklists, and ASO experiments. Apple’s dashboard remains the source for deeper analysis and official definitions.
Turn metrics into the next useful decision
The goal of App Store Connect analytics is not to monitor every available number. It is to understand one part of the user journey well enough to make a better decision.
Begin with a question. Confirm the metric definition. Compare complete periods. Segment the result. Check what changed in the app and its acquisition. Then create a specific task, continue observing, or decide that no action is justified.
That final step is where analytics becomes product management rather than another dashboard.